Introduction
Motors consume approximately 65% of industrial electricity, translating to significant operating costs and environmental impact. Mastery of motor system components, operational efficiencies, detailed maintenance procedures, and system optimization strategies is essential for effective energy assessment and management.
Before we get into the more technical details, check out this Electrical Engineering for Energy Assessments Primer to make sure you understant the necessary background information.
Electrical Engineering for Energy Assessments
Motor Types and Operating Principles
Single-phase Motors: Single-phase motors operate on a single AC voltage waveform. They inherently exhibit pulsating torque, resulting in mechanical vibration or “wobble.” This pulsation is due to the sinusoidal nature of single-phase power, which periodically drops to zero power output twice every cycle (60 times per second). These motors are suitable for smaller applications with lower torque demands, such as household appliances and small equipment.
Three-phase Motors: Three-phase motors use three separate AC waveforms, offset by 120 degrees each, significantly reducing torque pulsation. This results in smoother, more continuous power output, higher starting torque, and higher efficiency. They are widely used in industrial environments due to their reliability and consistent performance under heavy loads.
Check out this video if you want to learn more about how electric motors work:
Motor Efficiency: Standards, Economics, and Technology
Efficiency Standards: In 1997, the Energy Policy Act (EPAct) introduced minimum efficiency standards, improving baseline motor efficiency. Motors are classified into standard efficiency (EPAct-compliant) and premium efficiency motors. Premium motors typically feature improved materials such as higher-grade copper windings, optimized rotor and stator designs, and better bearings to minimize energy losses.
Economic Considerations: Premium efficiency motors typically cost approximately 20% more than EPAct-compliant motors, offering efficiency improvements around 1-2%. Payback periods vary based on usage conditions but often extend several years, influencing industry decisions towards initial cost savings despite higher operational expenses.
Efficiency Technologies: Premium motors typically have:
- Enhanced copper windings (reduced resistive losses)
- Improved rotor and stator geometry (minimizing eddy current and hysteresis losses)
- Higher-quality bearings (reducing friction losses)
Reading Nameplates
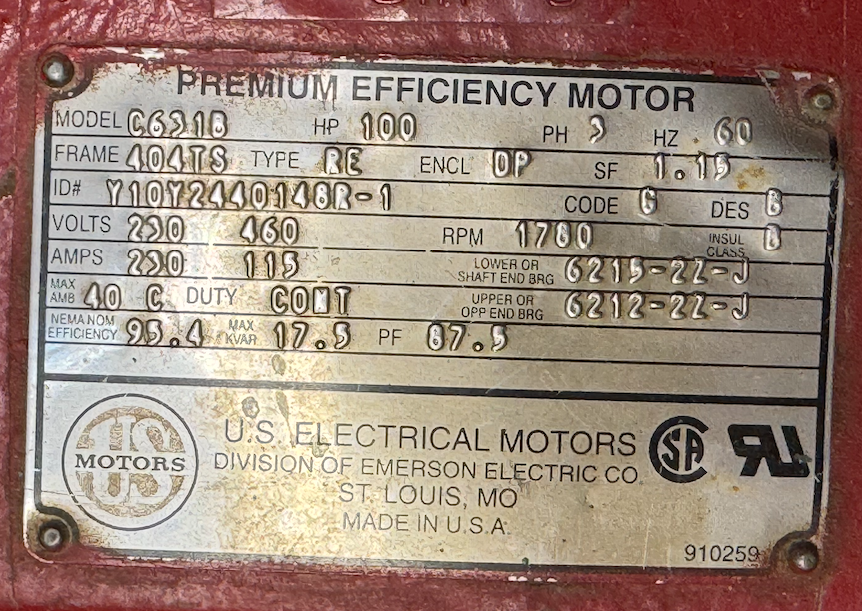
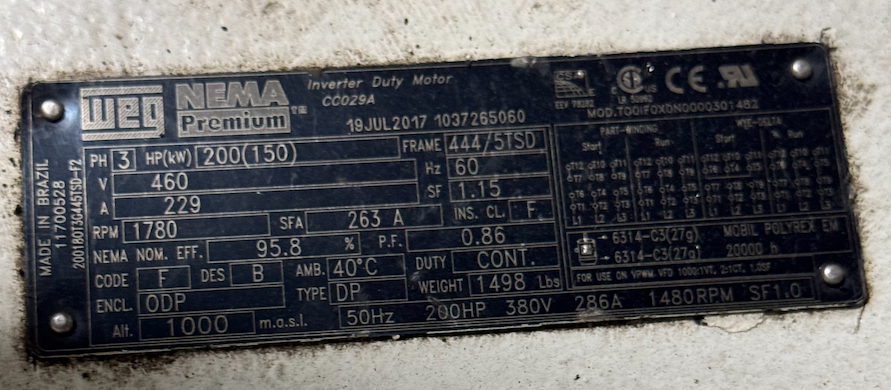
There’s two main things we want to know when looking at a motor: Power and Efficiency. Both of these are on the nameplate, so it’s important you know what you’re looking at. Take a look at each of the nameplates below and identify the power (in hp) and efficiency.


NEMA Efficiency Ratings
A lot of the time, when you’re looking at a motor nameplate, you’ll see the efficiency as a percent, like in the examples above. However, sometimes you’ll see a letter instead. When this happens, look up the actual efficincy in this table:
| NEMA Letter Index | Nominal Efficiency | Minimum Efficiency |
|---|---|---|
| A | 95.0 | |
| B | 95.0 | 94.1 |
| C | 94.1 | 93.0 |
| D | 93.0 | 91.7 |
| E | 91.7 | 90.2 |
| F | 90.2 | 88.5 |
| G | 88.5 | 86.5 |
| H | 86.5 | 84.0 |
| K | 84.0 | 81.5 |
| L | 81.5 | 78.5 |
| M | 78.5 | 75.5 |
| N | 75.5 | 72.0 |
| P | 72.0 | 68.0 |
| R | 68.0 | 64.0 |
| S | 64.0 | 59.5 |
| T | 59.5 | 55.0 |
| U | 55.0 | 50.5 |
| V | 50.5 | 46.0 |
| W | 46.0 |
Sources of Motor Inefficiencies
Electrical Losses:
- I²R Losses (Copper Losses): Heat generated due to resistance within motor windings, proportional to the square of the current.
- Core Losses (Eddy Current and Hysteresis): Energy dissipated in the iron core due to alternating magnetic fields.
Mechanical Losses:
- Friction Losses: Occur in bearings and seals.
- Windage Losses: Energy consumed by cooling fans attached to the motor shaft.
Operational Losses:
- Poor motor sizing or frequent operation at partial loads significantly reduces efficiency.
- Dirt accumulation, insulating the motor, increases operating temperatures and resistance losses.
Motor Maintenance Procedures
Maintenance Practices:
- Regular Cleaning: Ensuring motor casings and cooling vents are clear from dirt and debris to minimize heat buildup.
- Temperature Monitoring: Regular tracking of motor surface temperatures using infrared thermography or contact sensors to detect unusual heat trends.
- Vibration Analysis: Consistent measurement using magnetic-mounted accelerometers to detect alignment issues, bearing degradation, or imbalance in the motor and load coupling.
Reliability Enhancement:
- Establish a proactive motor maintenance plan to prevent unexpected downtime.
- Conduct detailed trend analysis of temperature and vibration data, enabling predictive maintenance and timely interventions.
- Clearly mark measurement points for consistent monitoring to identify degradation early.
Motor Rewinding vs. Replacement Decisions
Technical Considerations for Rewinding:
- Rewinding motors may reduce efficiency by 1-5%, primarily due to high-temperature damage to core laminations and winding insulation during the rewind process.
- Lamination damage increases core losses, particularly eddy current losses.
- Excessive heat during rewinding degrades winding insulation, increasing short-circuit risks and decreasing long-term efficiency.
Recommended Practices:
- Limit motor rewinding to one occurrence per motor.
- Mark rewound motors clearly and plan for replacement to maintain operational reliability and energy efficiency.
Advanced Motor System Optimization
Variable Frequency Drives (VFDs): VFDs adjust motor speed according to real-time load demands, significantly reducing energy consumption in variable-load scenarios. They save energy by intelligently matching motor speeds to their actual load requirements. Traditional motors typically run at a constant speed, regardless of how much work is required, causing unnecessary energy consumption. VFDs address this issue by controlling the motor’s frequency and voltage, allowing it to operate precisely at the speed needed. Because energy usage in many applications, such as pumps, fans, and compressors, is proportional to the cube of motor speed, even minor reductions in speed can greatly reduce energy consumption. This results in significant cost savings, improved system efficiency, and reduced environmental impact.
Check out this video if you want to learn more about how VFDs work:
System Design Optimization: Proper motor sizing saves energy by ensuring motors operate close to their optimal load and efficiency levels. When motors are oversized, they consistently operate below their rated capacity, leading to lower efficiency, wasted electrical energy, and excess heat production. Correctly sized motors avoid these problems by closely matching the motor’s capacity to the load requirements, enabling them to run efficiently at or near full load. Proper motor sizing reduces unnecessary electricity usage, extends equipment lifespan, lowers maintenance costs, and contributes to improved overall energy efficiency in industrial and commercial settings.
Furthermore, efficient drive systems, such as gearboxes and belt drives, contribute significantly to energy savings by effectively transmitting mechanical power from motors to their loads. High-quality gearboxes reduce energy loss through optimized gear ratios and precision manufacturing, minimizing friction and heat generation. Similarly, modern belt drives, including synchronous (toothed) belts, offer improved efficiency by reducing slippage and frictional losses compared to older, less efficient drive systems. Selecting and properly maintaining efficient drive components ensures minimal power loss, improved reliability, reduced operating costs, and extended equipment life.
More Resources
Check out this video by Mike Muller that goes more in-depth on these concepts:
Activity
A manufacturing facility is operating a motor with a nominal efficiency of 80%. Management is considering replacing this motor with a more efficient model. The motor operates under a constant load of 50 horsepower (hp) and runs 2500 hours per year. The facility pays $0.12 per kWh for electricity.
Part 1: Efficiency Upgrade Comparison at 2500 Hours/Year
You are tasked with evaluating the annual energy consumption and electricity cost for the current motor and potential replacement motors with nominal efficiencies of 85%, 90%, and 93%.
Given:
- Motor Load = 50 hp
- 1 hp = 0.746 kW
- Motor Runtime = 2500 hours/year
- Electricity Cost = $0.12/kWh
Instructions:
- Calculate the input power required for each motor (in kW).
- Calculate the annual energy consumption (kWh).
- Calculate the annual electricity cost.
- Determine the energy and cost savings compared to the current 80% efficient motor.
Part 2: Runtime Sensitivity at 90% Efficiency
Now assume the motor is upgraded from 80% to 90% efficiency. Examine how savings scale with increased runtime: 2500, 4000, and 6000 hours/year.
Instructions: 1. Use the same method from Part 1 to calculate annual energy use and cost for both 80% and 90% efficient motors. 2. Calculate the difference in energy use and cost at each runtime.
Part 3: Financial Analysis
For each of the scenarios in parts 1 and 2, calculate the implementation cost and simple payback period. We have each of the following motor costs:
- 85% - $3,306
- 90% - $3,600
- 93% - $4,104
Each motor will also take 2 hours to install. The installer’s labor is $50/hr.
\[ \text{Simple Payback Period} = \frac{\text{Initial Investment}}{\text{Annual Savings}} \]
Quiz
1. Which of the following statements about single-phase motors is TRUE?
A. They operate on three AC waveforms, providing smooth torque output
B. They are ideal for heavy industrial loads
C. They exhibit pulsating torque and are suitable for small applications
D. They are more efficient than three-phase motors
2. Which is not a reason why premium efficiency motors are more expensive than EPAct-compliant motors?
A. Use of higher-grade copper windings
B. Optimized rotor and stator design
C. Improved bearings
D. Energy Star charges expensive licensing fees
3. According to the NEMA table, what is the nominal efficiency of a motor with an index letter of “C”?
A. 93.0%
B. 94.1%
C. 95.0%
D. 90.2%
4. Which of different efficiency options represents the best investment at 2500 hours runtime from the activity?
80%
85%
90%
93%
5. What's the payback period for upgrading to a 90% efficient motor running for 4000 hours/year? (Round to the nearest tenth)